
10
BI capabilities
Assessment, integration, modeling, dashboards, automation, forecasting, and maintenance.
CF Outsourcing helps organizations connect operational data, define meaningful performance measures, automate recurring reporting, and build dashboards that give leaders clearer visibility into what is working, what is not, and where action is needed.
CF helps teams replace scattered spreadsheets and inconsistent metric definitions with governed dashboards, recurring reports, exception views, and QA habits that support faster operating decisions.
10
Assessment, integration, modeling, dashboards, automation, forecasting, and maintenance.
7
Define, connect, reconcile, model, visualize, validate, and improve.
6
Revenue cycle, credentialing, care, staffing, marketing, and executive operations.
BI support starts with the decisions teams need to make, then works backward through source systems, definitions, reporting cadence, dashboard users, and QA expectations.
Analytics workflow
Sources
Model
Dashboards
Action
One governed path from scattered exports to a view leaders can use.
Capability map
Foundation
Create a dependable reporting base before adding more dashboards.
Review data sources, reporting needs, operating cadence, dashboard users, and decision requirements.
Connect source systems, spreadsheets, exports, and reporting tools into maintainable workflows.
Structure data for recurring analysis, role-based reporting, executive visibility, and auditability.
Define metrics, ownership, calculation rules, thresholds, and reporting context.
Reporting & adoption
Deliver the right level of visibility to each audience and keep it current.
Build views for leadership, operations, revenue cycle, credentialing, marketing, staffing, and care programs.
Reduce manual reporting effort through scheduled reports, recurring dashboards, and exception views.
Give executives, department leads, and frontline supervisors the view built for their decisions, not one dashboard for everyone.
Keep dashboards accurate as source systems, metrics, and reporting needs change, instead of letting them go stale after launch.
Analysis & planning
Move beyond reporting what happened to understanding capacity, productivity, and what comes next.
Track throughput, cycle time, and workload distribution across staffing, RCM, credentialing, and care-program teams.
Project volume, revenue, and staffing needs from historical patterns so leaders can plan capacity ahead of demand.
The dashboard only helps if teams trust the definitions, timing, sources, and exceptions behind it. CF builds QA and governance into the reporting rhythm.
Always-on QA
Source totalsreconciled
Definitionsdocumented
Exceptionsreviewed
Dashboardsrefreshed
Built-in controls
Confirm data sources and refresh patterns before decisions depend on the output.
Document what each metric means, who owns it, and how teams interpret it.
Compare source totals, reporting outputs, and known exceptions.
Surface issues, missing data, outliers, and workflow bottlenecks.
Keep people responsible for review, judgment, and escalation.
Make recurring reports easier to maintain and explain.
Validation cycle
CF works inside client-approved data and reporting environments. Specific platforms, connections, permissions, and responsibilities are validated during discovery rather than assumed from a generic technology list.
Operational databases, CRM, ERP, EHR or practice-management systems, revenue-cycle platforms, marketing systems, ticketing tools, spreadsheets, secure files, and APIs when access and integration are feasible.
SQL databases, cloud data platforms, BI visualization and reporting tools, spreadsheet workflows, and secure data exchanges. Named platform support is confirmed for each engagement.
Scope can include source mapping, extraction and transformation support, reconciliation, data modeling, KPI definitions, dashboard development, recurring reporting, and operational analysis.
Access follows the client-approved environment, least-privilege permissions, documented data handling, authentication and logging requirements, review controls, and agreed retention or transfer rules.
Timing is set after discovery based on source access, data quality, integration complexity, metric definitions, validation needs, stakeholder availability, and release requirements. CF does not publish a universal launch range before assessment.
Platform compatibility, implementation scope, delivery sequence, and responsibilities are documented before build work begins.
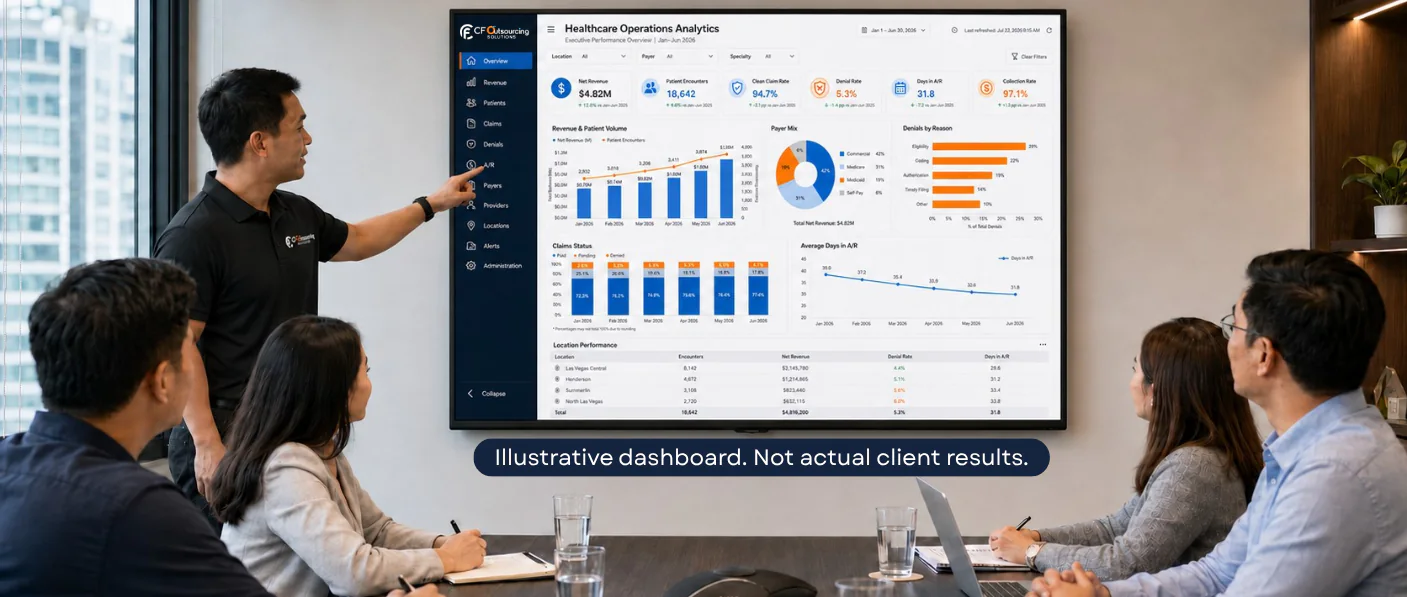
BI support shows up the same way across every specialized company CF runs. This example shows what a governed operations dashboard looks like once it is in place.
Revenue Cycle
Provider Credentialing
Care Management
Staffing Performance
Marketing Performance
Executive Operations
See how this looks for your team.
Explore Business Intelligence and AnalyticsThis service is strongest when the organization already has activity and source data, but leaders need cleaner definitions, faster views, and better exception handling.
Give leadership a shared operating view without waiting on manual report assembly.
Track throughput, cycle time, quality, staffing, and workload distribution by team.
Reduce spreadsheet churn by standardizing cadence, refresh patterns, and owners.
Document calculations and context so dashboard conversations stay grounded.
CF can review your current sources, spreadsheet process, metric definitions, and reporting cadence, then shape a practical BI roadmap around the work your leaders need to do.
Use dashboards alongside managed workflows, dedicated analysts, and clearly assigned operating owners.